Exploring Your Data
This tutorial shows you how to use the interactive map browser to explore your fitness activities.
Starting the Browser
Generate and serve the browser:
This opens http://127.0.0.1:8080 with your activities.
Offline Use
The generated mykrok.html file works offline. Just open it directly in your browser.
The Map View
The map view shows all your activities on an interactive map.
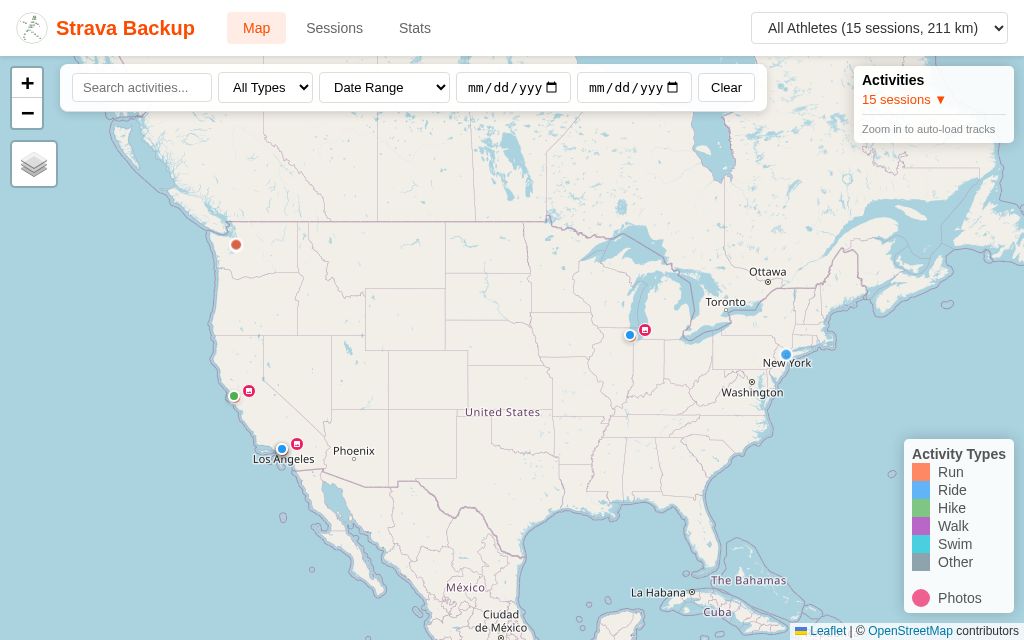 Map view with activity markers
Activity Markers
- Each activity is shown as a colored marker at its starting location
- Colors indicate activity type (blue for rides, green for runs, etc.)
- Click a marker to see activity details
Viewing Tracks
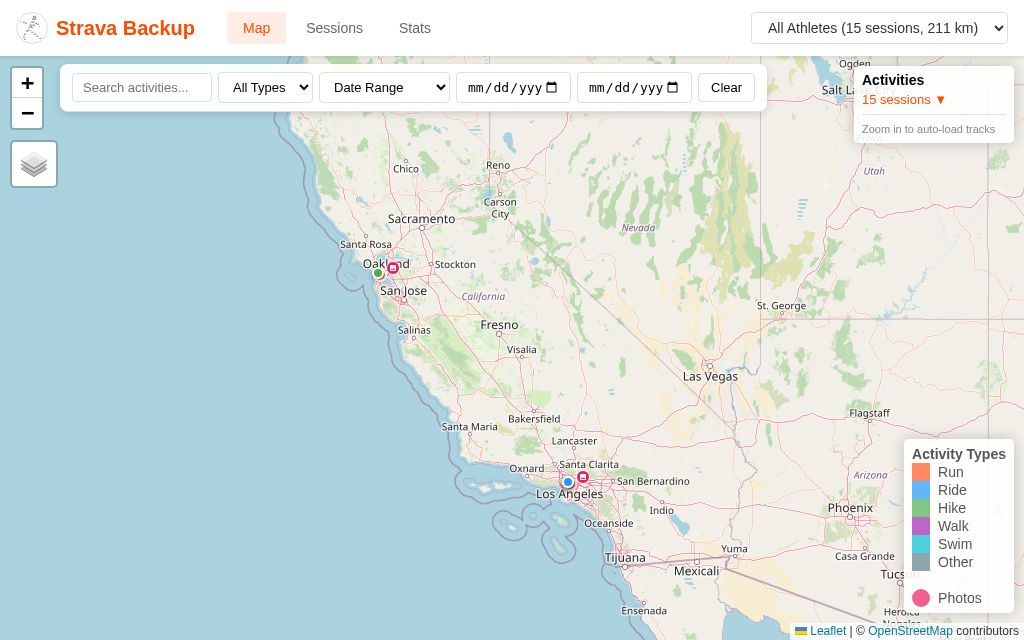 Activities zoomed to fit with GPS tracks visible
Click a marker to:
- See the activity popup with name, date, distance, and stats
- View the full GPS track on the map
- Navigate to photos if available
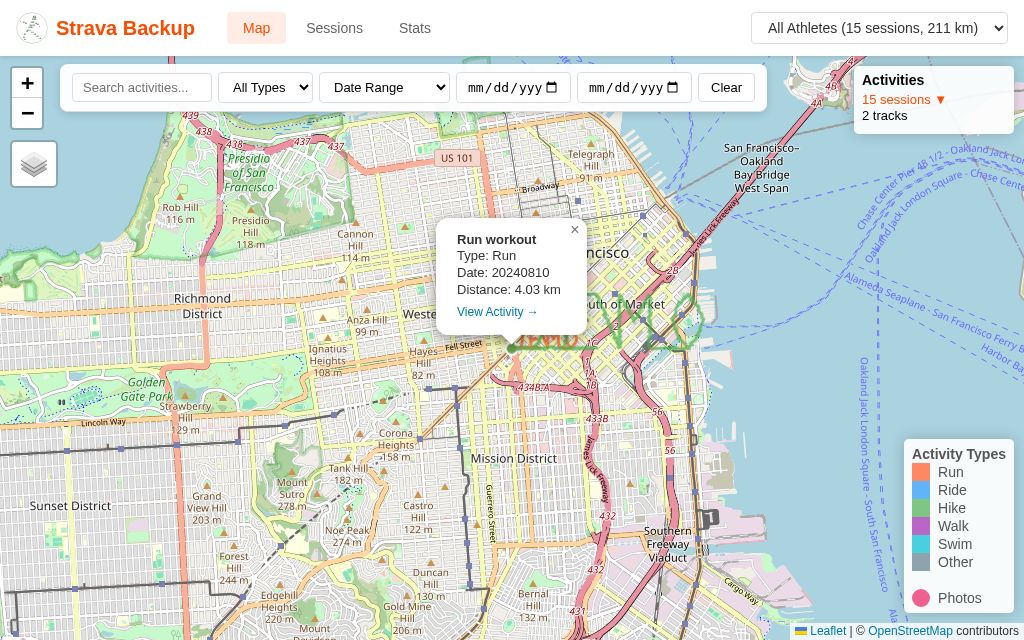 Activity popup showing details, photos, and navigation
Map Controls
- Zoom: Mouse wheel or +/- buttons
- Pan: Click and drag
- Fit bounds: Click the bounds icon to fit all visible activities
- Filter to view: Toggle to show only activities in the current map view
The Legend
The color legend on the left shows activity types. Click a type to:
- Filter to show only that type
- Click again to show all types
The Activities Panel
The right panel lists all activities.
Filtering
Use the filter bar to narrow down activities:
- Date range: Select start and end dates
- Type filter: Filter by activity type
- Search: Search activity names
Sorting
Activities are sorted by date (newest first).
Activity Details
Click an activity to:
- Center the map on that activity
- Show the GPS track
- Open the popup with details
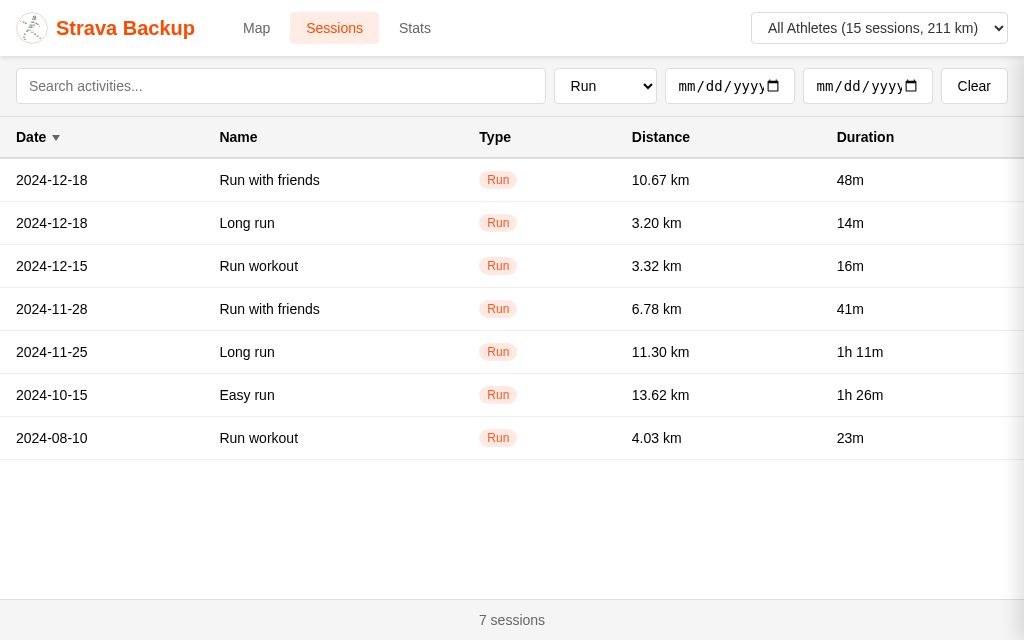
The Sessions View
Switch to Sessions view for a full list of all activities with more details.
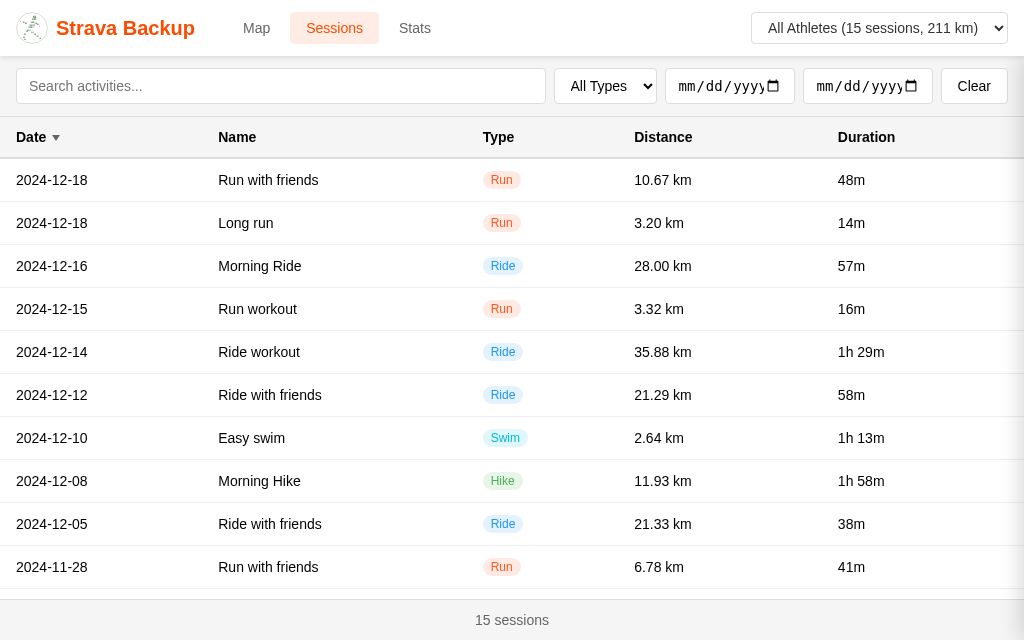 Sessions list with date and type filters
Columns
- Date and time
- Activity type
- Name
- Distance
- Duration
- Elevation gain
- Heart rate (if recorded)
 Sessions filtered by activity type
Session Details
Click a session to see:
- Full activity metadata
- Sensor data graphs (elevation, heart rate, cadence)
- Photos
- Comments and kudos
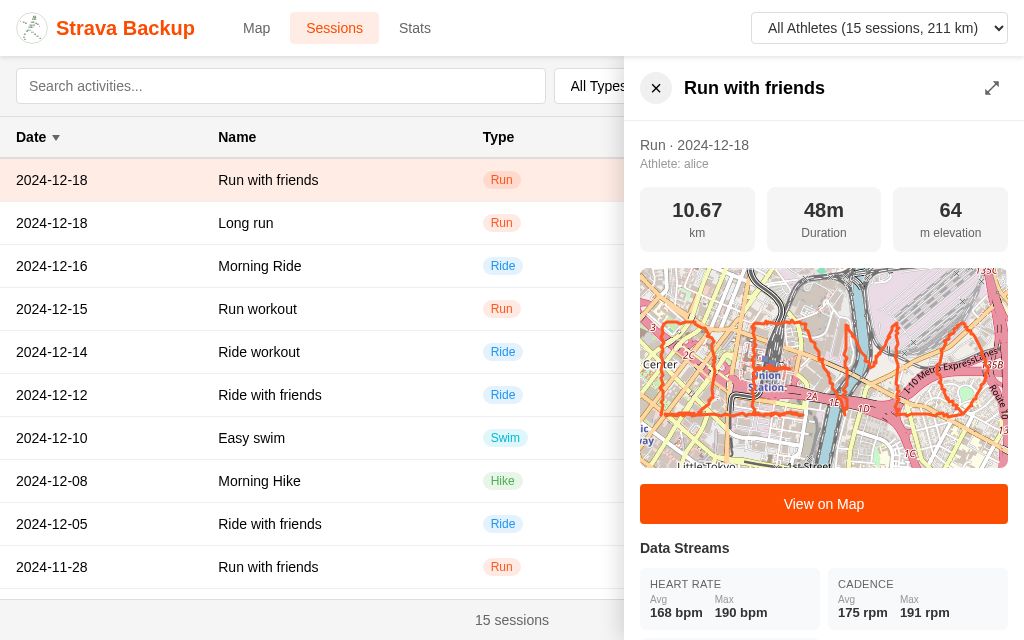 Session detail panel with metadata
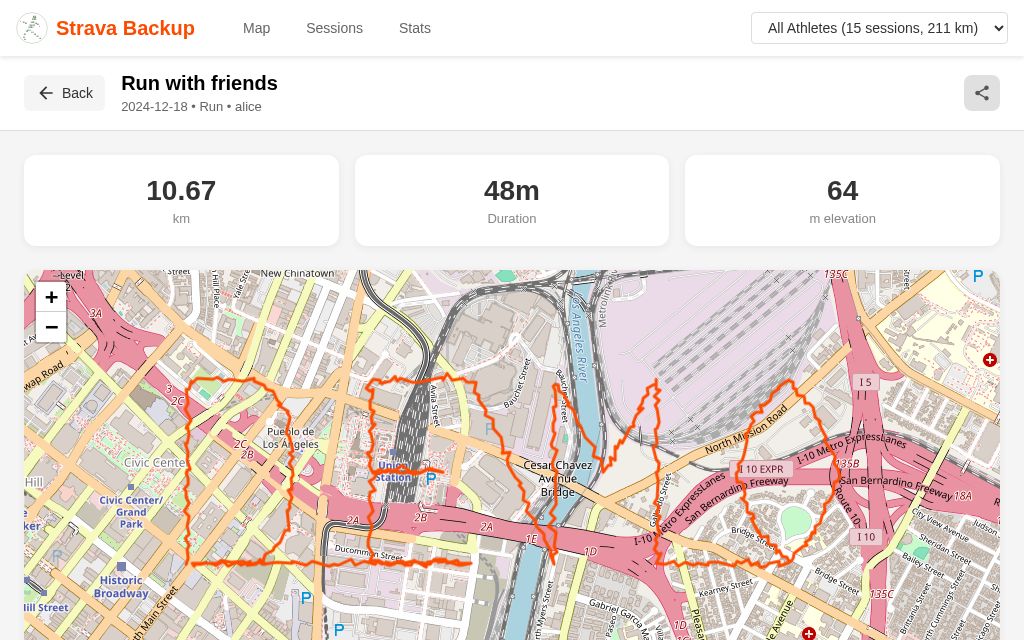 Full-screen session view
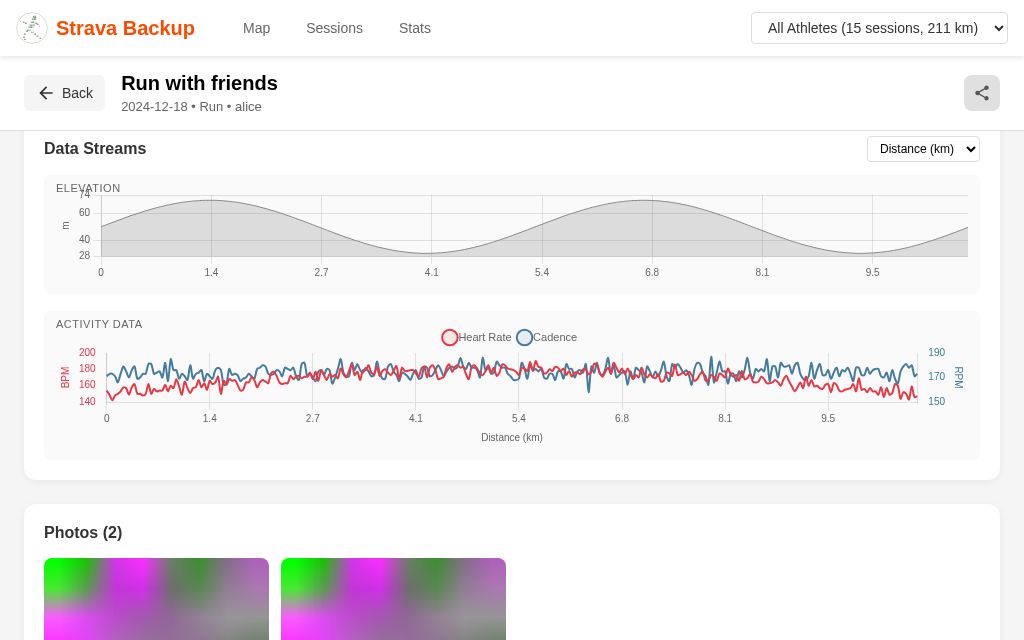 Activity data streams: elevation, heart rate, cadence
The Stats View
The Stats view shows aggregated statistics.
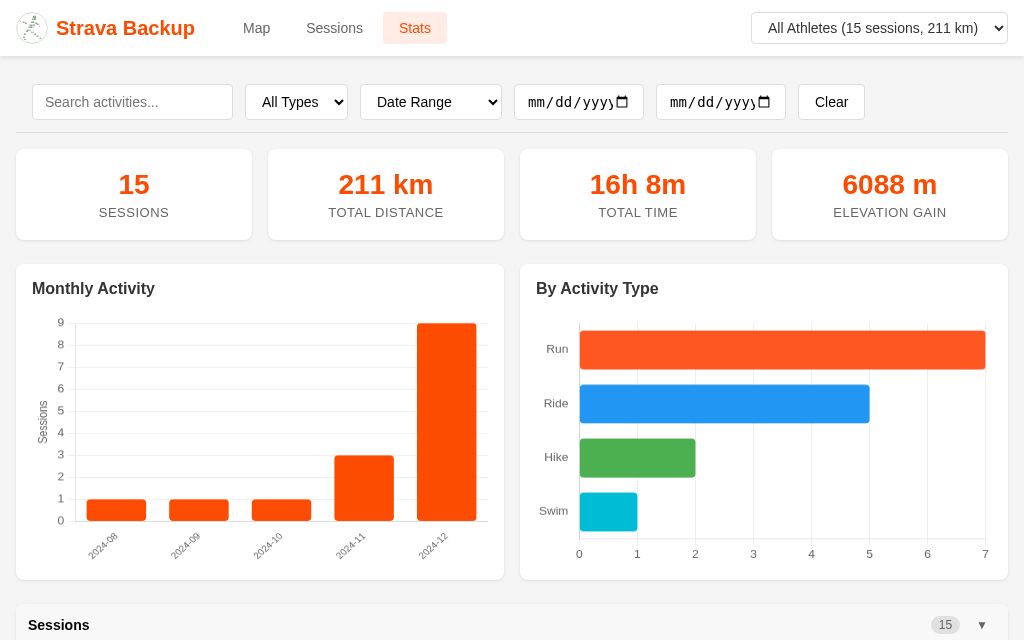 Statistics dashboard with charts
Charts
- Activities by month: Bar chart showing activity count over time
- Activities by type: Horizontal bar chart with activity types sorted by count
Activity Timing Heatmap
The timing heatmap shows when you typically exercise:
- Y-axis: Days of the week (Monday through Sunday)
- X-axis: Hours of the day (0-23)
- Color intensity: Darker cells indicate more activities at that time slot
This helps identify your training patterns - whether you're a morning runner, lunchtime cyclist, or evening walker.
Activity Calendar Heatmap
The calendar heatmap (GitHub contribution-style) shows your activity history over time:
- Y-axis: Days of the week (Monday through Sunday)
- X-axis: Weeks (scrollable if many weeks)
- Color intensity: Darker cells indicate more activities on that day
- Clickable: Click any cell or column to filter sessions to that week
Month labels appear at the top when a new month starts. Hover over any cell to see the exact date and activity count.
Filtering
Use the filter bar to see stats for specific date ranges or activity types.
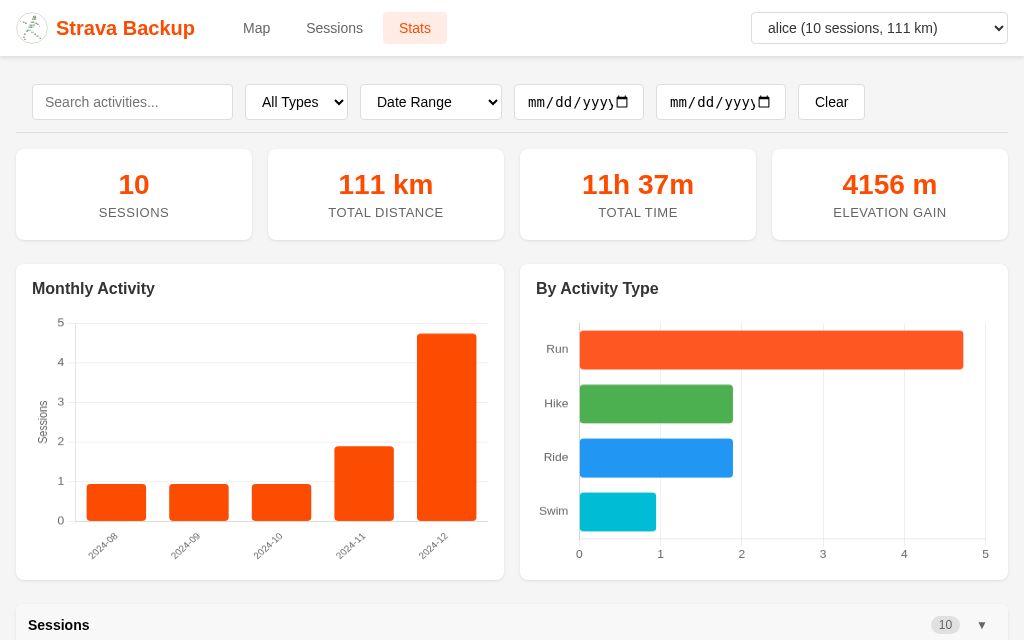 Statistics filtered by athlete
URL Sharing
The browser preserves state in the URL, so you can:
- Share a link to a specific activity
- Bookmark filtered views
- Return to where you left off
URL Parameters
view=map|sessions|stats- Current viewfrom=YYYY-MM-DD- Start date filterto=YYYY-MM-DD- End date filtertype=Run,Ride- Activity type filtertrack=username,datetime- Selected trackvp=1- Viewport filter enabled
Keyboard Shortcuts
When viewing photos:
- Left/Right arrows: Navigate between photos
- Escape: Close photo viewer
Tips
Finding Activities
- Use the search box to find activities by name
- Use date filters to narrow down time periods
- Use the "filter to view" toggle to see only activities in the current map area
Comparing Activities
- Filter to a specific route or area
- Compare dates and times
- Look at pace/speed trends over time
Identifying Patterns
- Use the Stats view to see monthly trends
- Filter by activity type to focus on specific training
- Look at elevation profiles for route analysis